P.
 Posts
Contact Me
Posts
Contact Me
Posts
Contact Me
Posts
Contact Me
11/24/2025
SOCs have layers. Onions have layers... You get it?
In continuation of upgrading my network security, I am now monitoring my network with Security Onion.
Security Onion is a Linux operating system designed for log management, threat hunting, and network security monitoring. Essentially, it is a Security Operation Center (SOC). It has plenty of security tools integrated into it, and has been deployed in multiple governments and other professional environments.
In this post, I will show you how I setup and utilized both of these tools to better understand network traffic, implement integration of host endpoints and pfSense, and identify threats made through false positives and a simulated attack.
Don't freight! This post is not as theory-orientated as the last one. This post is more focused on evaluating information, and most of it is presented through pretty graphs that Security Onion makes for us.
Well, once it is setup, of course.
First and foremost, grab the ISO file for the Security Onion virtual machine.
For reference, I installed Security Onion on my Proxmox host, which it will be assumed that you know the basics of setting up a VM for the resource requirements and recommendations. If you are installing Security Onion on a separate machine, steps will differ depending on the version.
First, we will configure Security Onion, and it loves to have an adequate amount of CPU power and RAM. It is recommended for the standalone version (the one I am using) to have 24 GB of RAM. Personally, I am using 16 GB of RAM with ~3 GB of wiggle room, so for a small home network, it takes up about 13 GB. Besides RAM, a 4-core CPU and 200 GB of storage are recommended (I went with 250 GB), and 2 network ports are required- one port is for manaing Security Onion, and the other is for capturing your network traffic.
You will also need a switch that has the ability to mirror network traffic onto a port. This differs from the brand switch you have, but the idea is that you take the traffic from one port and you mirror it on another port, making it possible to monitor all of the traffic. Port 1 on my switch is my management VLAN, and I am mirroring that traffic to port 4, which is plugged into the third NIC port on my server. Security Onion virtually uses the third NIC as the mirror interface, and the fourth NIC as the management interface.
Here's a graph to better visualize:
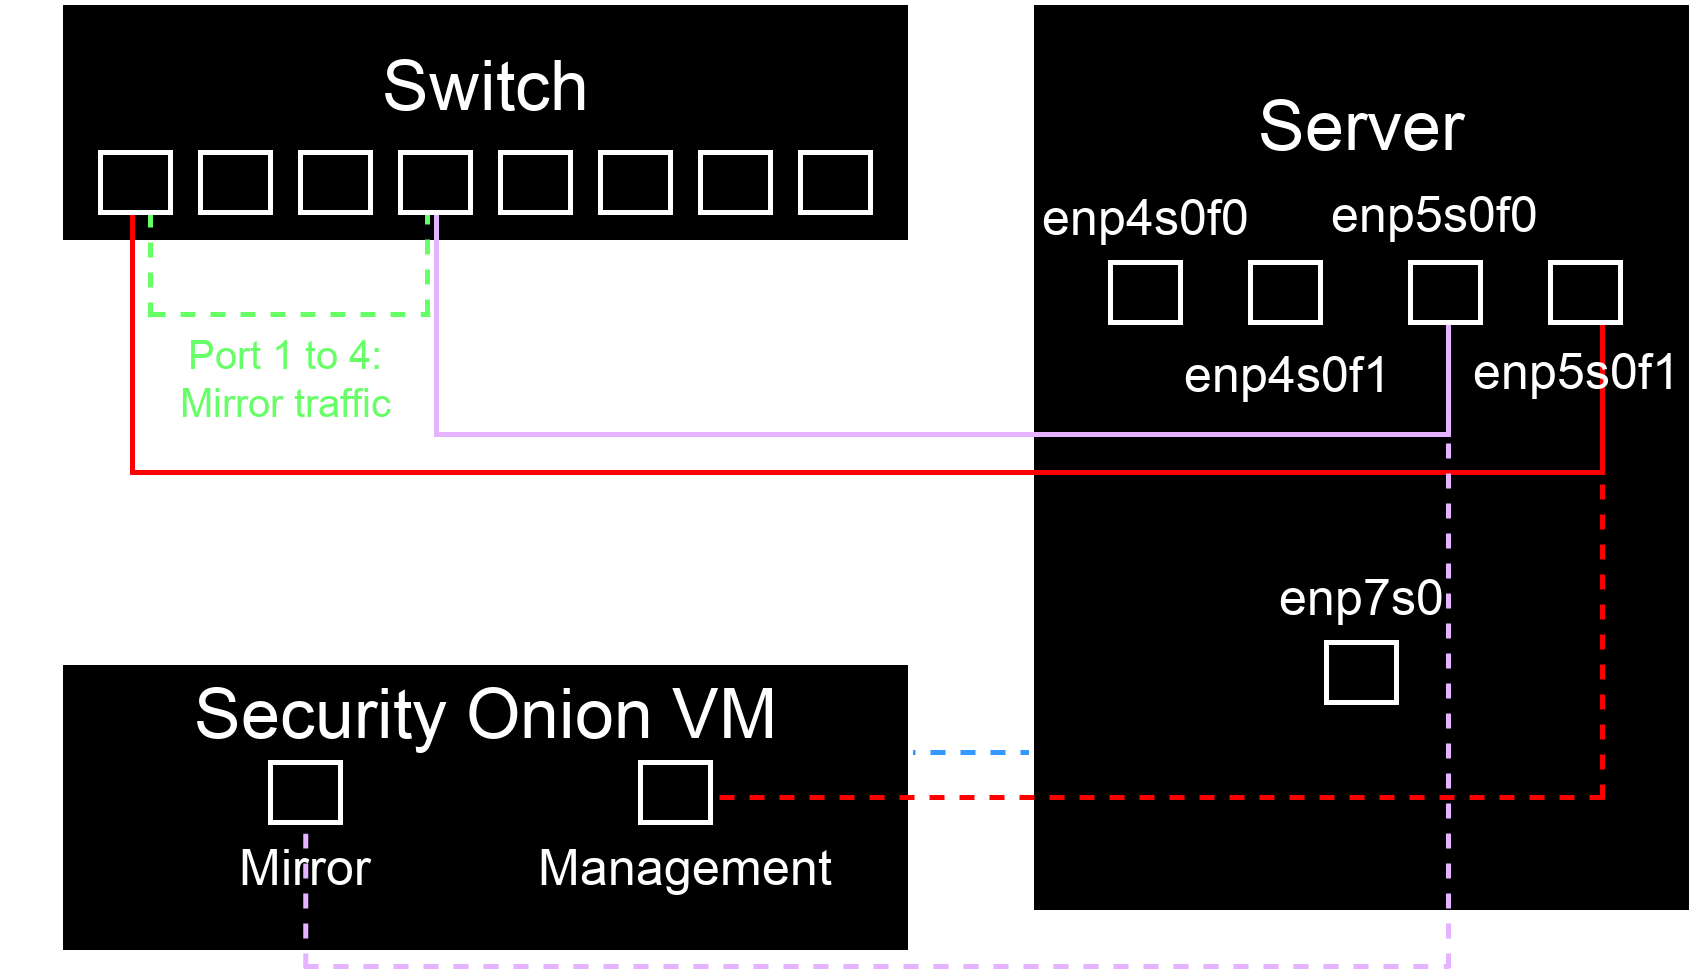
Note: I have a pfSense router VM for the quad-NIC.
Let's configure the third port on the server NIC, enp50f0. Here are my Proxmox network settings on my main node to better understand the labeling above and correctly map the ports.
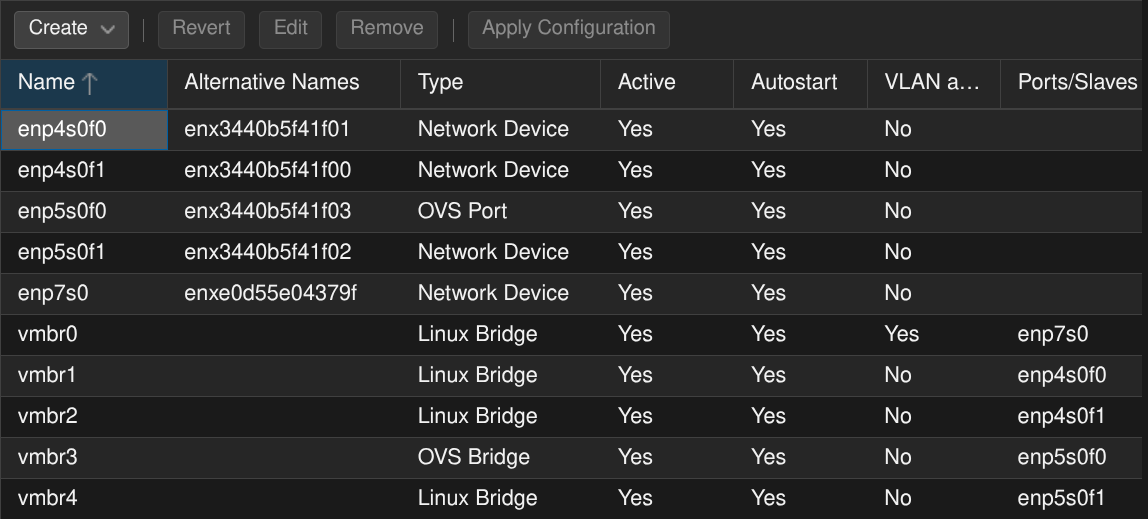
For the setup's sake, the only ports we are worrying about are enp50f0 and enp50f1. One will be set up with a virtual bridge, and the other will be setup as an OVS bridge. The port I use for management is enp50f1.
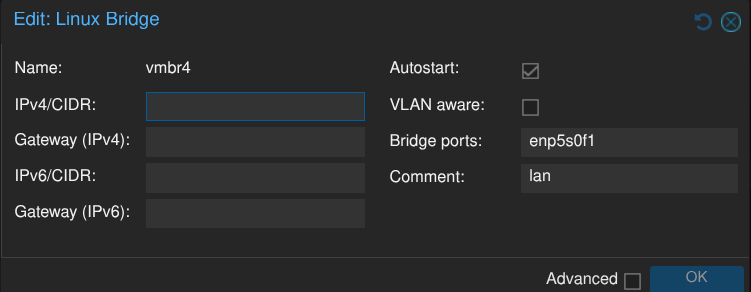
In Proxmox, you select Create, and then Linux bridge. Basically, you just map the port you want in the Bridge ports field, select OK, and it's good. That bridge will be the one we use to initially setup Security Onion. And while we're at it, let's (semi) configure the mirrored port.
We have to install the Open vSwitch package before we can make the OVS bridge in the network tab. Switch to the shell tab, and type in apt install openvswitch-switch.
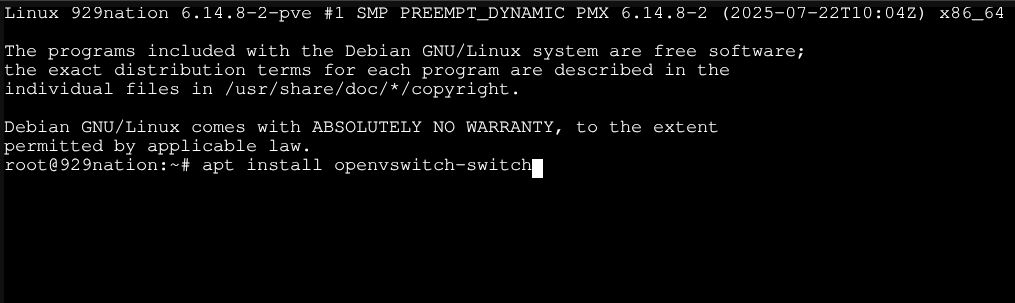
It will ask you if you are okay with the package taking up storage, in which you type y and press enter. After the package is done installing, we can back in the network tab and configure the OVS bridge.
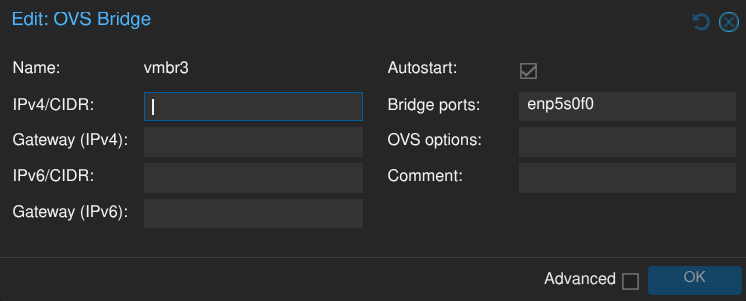
It's the same process as a Linux bridge, but it's an OVS bridge instead.
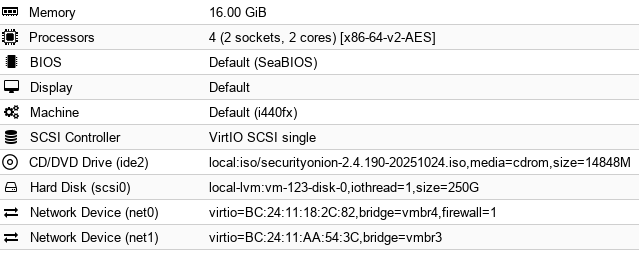
Now we can configure the VM for Security Onion. I mentioned above the main specs I will be using. During the setup however, we can only configure one NIC. So after the initial setup, we have to make sure that the OVS bridge is there, too.
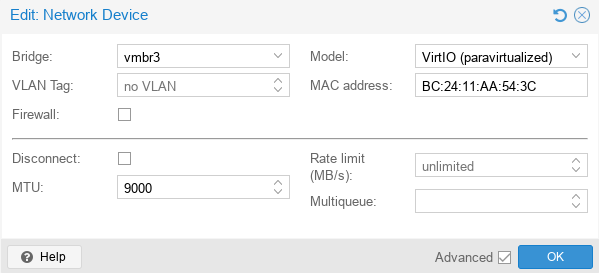
Go to the hardware tab for the Security Onion VM, and add in the OVS bridge. Make sure that the firewall is turned off for the OVS bridge, and ensure that the MTU size is set to 9000!
(Oh no! It's in light mode now!)
The VM configuration should look something like this:
At this point, we can start up the VM, and go through the initial installation (not the setup wizard).

Once presented in the CLI, type in yes in lowercase, then press enter. You will then be prompted for a username and password, and after that information is put in, it will proceed to install system components, and then you can get started with the setup wizard. This can take a while. Perhaps go on a walk around the block.
After walking the block a few times, hopefully you are ready to configure more system information in the setup wizard.
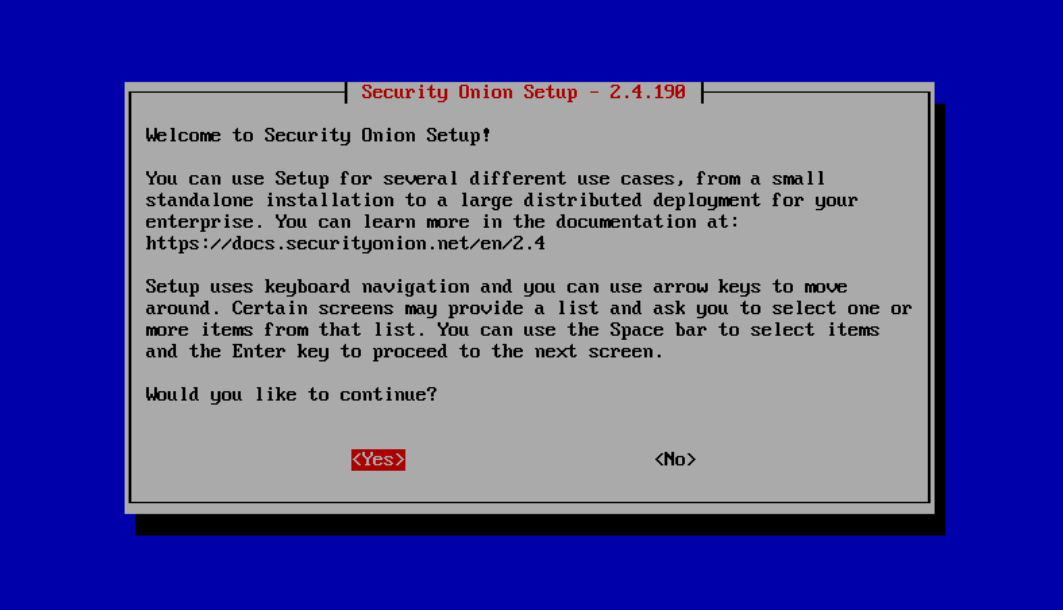
To select options at the bottom of the pop-up window, press enter. Select yes, and then the next screen will ask for the install of Security Onion. Select Ok.
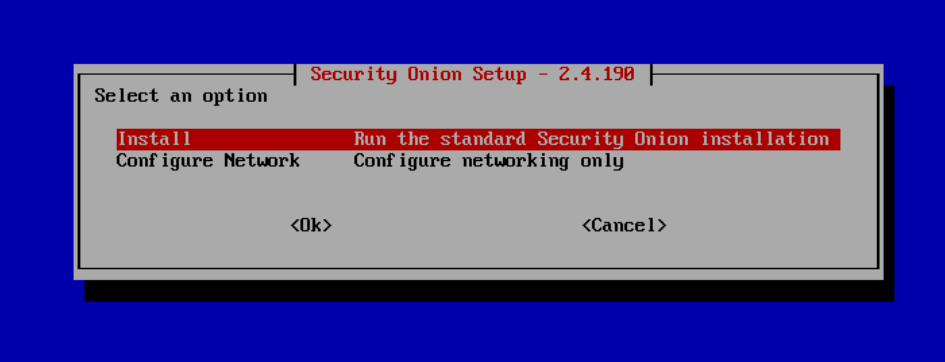
We are installing the standalone version of Security Onion, so use your down arrow to select the STANDALONE option. Select Ok.
At this point, you will agree to the Elastic license (part of the security stack), and make a hostname and description for your machine.
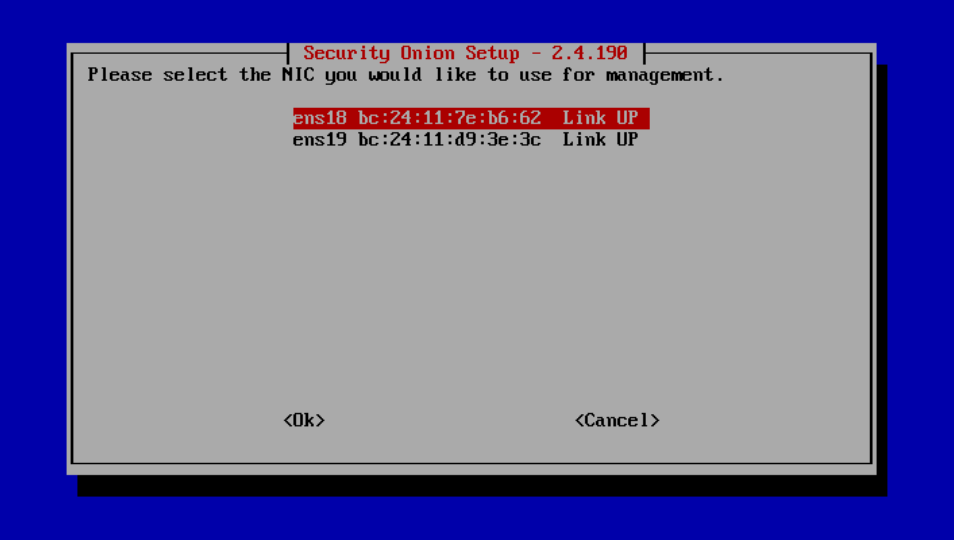
At this screen, you are prompted to choose the management port. The first option is typically the management port as we initially configured it. The actual numbers may vary for your setup installation. For mine, they were ens18 and ens19. Whatever number your mirror port may be will be important for later.
The setup is relatively straight-forward past that point. It will ask you to configure basic network settings, DNS, the management NIC which will be the only option to select, and some other options in between that you can just select the default option and be okay.
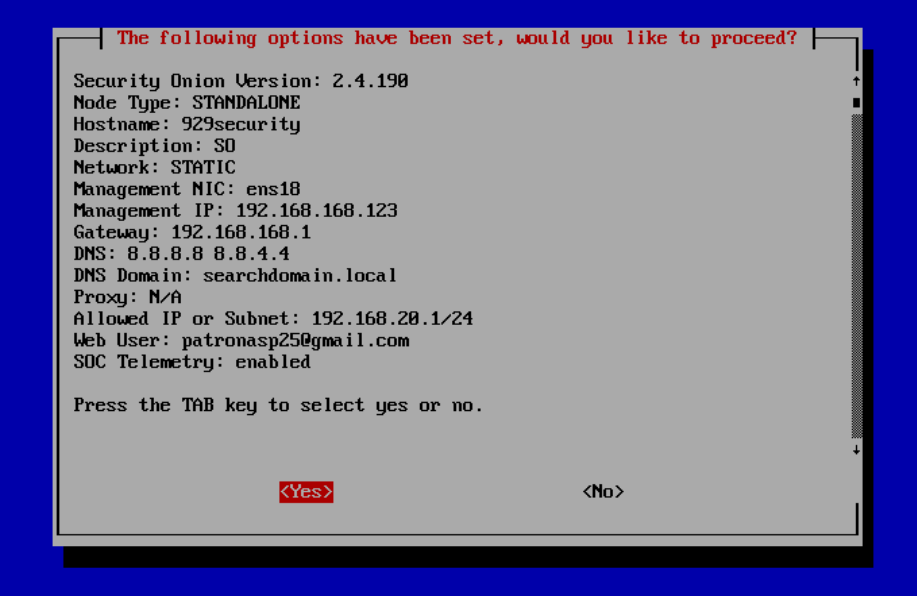
Once you are presented with a screen showing your information and making sure everything looks good, select Yes. Did you get tired of walking around the block the first time? I hope you didn't. You should probably do that again. It's going to take some time... again.
Okay! After a reboot (whenever it prompts you with the installation results), you should be prompted with the log in screen in the VM. Enter in the credentials that you made during the initial install, and now, we finish the configuration for the mirror port.
Type and enter in this command: sudo so-monitor-add en[mirror port number]. Whatever your number for the mirror port was in the setup, you replace where the bracktets are. If you forgot, you can input the command ip link to see all of the interfaces on the VM (it would most likely be the last one).
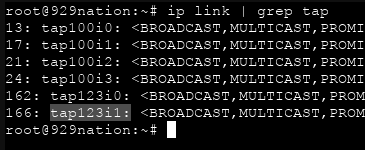
Almost done. Go back to the Proxmox's main node shell and run an ip link | grep tap. This will show all of your interfaces that have a tap interface for mirroring. The one we are looking for should be along the lines of tap[the number you gave your VM]i[number]. I made my VM number 123, so it is tap123i1.
After you find that, copy and paste this absolute monster of a command, replacing the necessary information in the brackets:
ovs-vsctl -- --id=@p get port tap[the number you gave your VM]i[number] -- --id=@m create mirror name=span0 select-all=true output-port=@p -- set bridge vmbr[number that correlates to your OVS bridge] mirrors=@m
You should get some output that looks like some alphabet soup. To check to see if our mirror port is working, go back into the Security Onion VM and run sudo tcpdump -vi en[mirror port number].
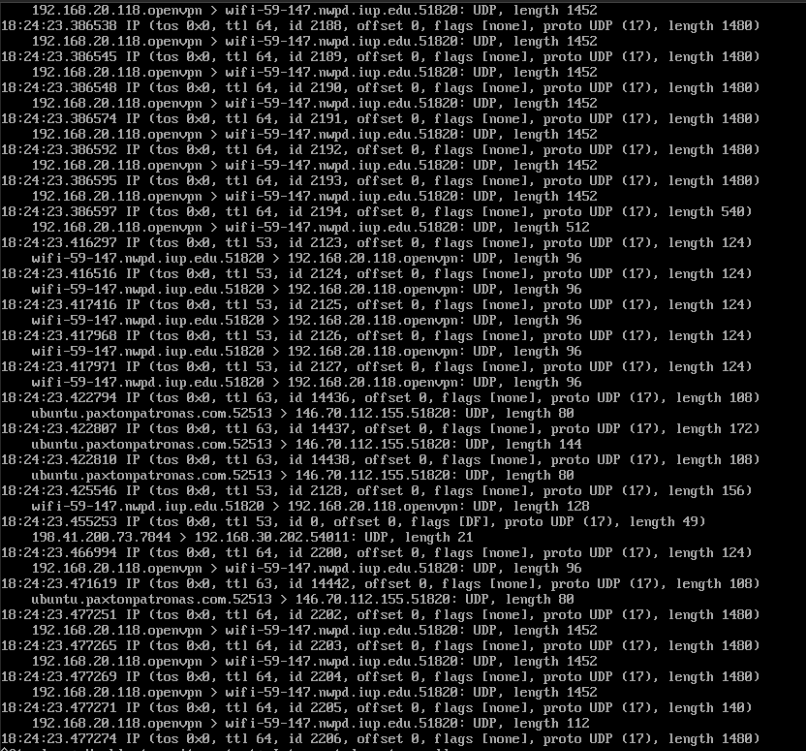
The traffic should look something along the lines of this. It purely depends what is running off of the port that you are mirroring, although, if you are only seeing traffic from the Security Onion IP and its multicast address, something went wrong and you have to backtrack.
The hard part is done! An important note before we explore what Security Onion has to offer: the mirror port resets anytime the Security Onion instance is reset, so the commands regarding so-monitor-add and ovs commands have to be entered again, plus a command before the huge ovs command in the Proxmox main node: ovs-vsctl clear bridge vmbr[number that correlates to your OVS bridge] mirrors. Again, to make sure that the mirrored traffic is coming into the Security Onion instance, run the tcpdump command.
Enter in your Security Onion IP into a web browser. You will get a warning about it be unsecure; this is because it uses a self-signed certificate. It is safe to proceed.
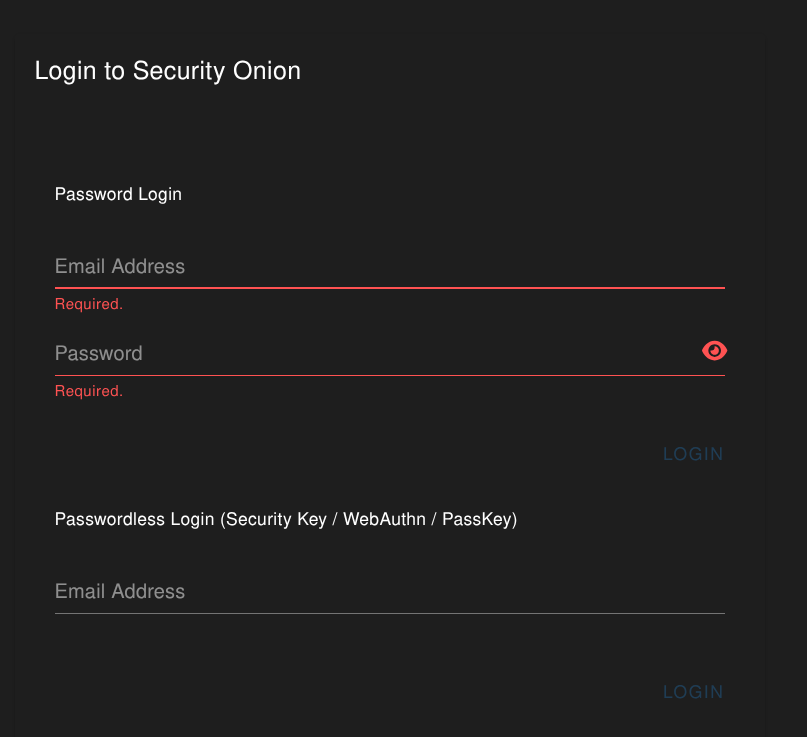
Enter in the credentials you made during the setup wizard. These credentials will be used to log in to all of the tools Security Onion provides.
The actual Overview tab in Security Onion is just a landing page that is meant to help out any new users that don't know where to start. Nothing terribly interesting. But the next tab is...
If you just downloaded Security Onion, there may not be a lot of traffic to inspect. I have been running it in my lab for at least two weeks, so there is a lot of information it has observed. Bare that in mind.
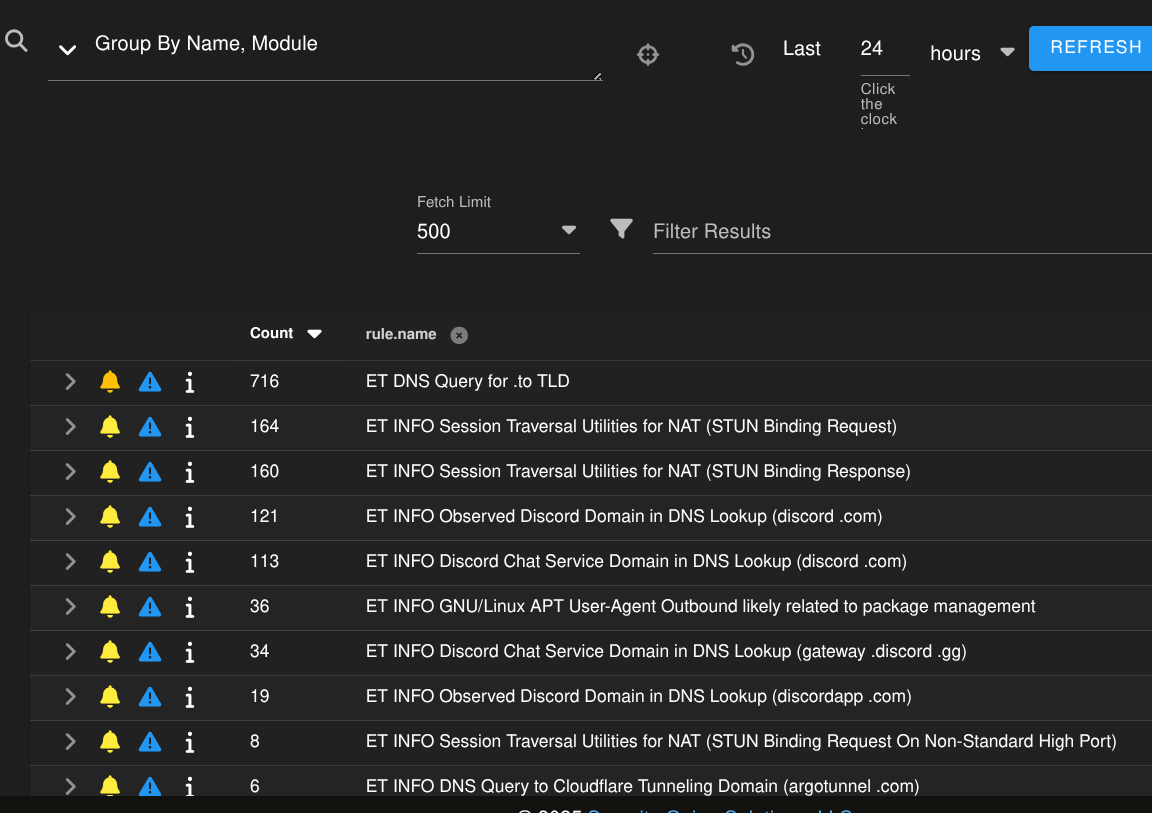
Here, Security Onion has taken our network traffic that we mirrored, and Suricata, a network-based intrusion detection system (NIDS) has marked traffic from certain rule sets and patterns it has recognized (known as signatures). Does this mean everything it detects is truly a threat? Thankfully, no. Most of these are false positives.
False positives are alerts that come in that claim that something is malicious, when it is actually not. Why bother with so many alerts if they could all be false positives? Well, you can think of Security Onion as an overprotective parent. While you were walking around the block waiting for the installs to complete, you could have tripped, landed on your head, and been sent to the hospital. The chances of that happening are low, but it could be bad. Maybe not the best analogy, but those are most of these alerts. Security Onion just wants to make sure that we are as safe as possible, even if the threat is practically not there. Threats are cateogorized by severity levels, and you can organize your threats to see which ones you might actually want to worry about.
Scroll horizontally on a scrollpad or locate the horizontal scrollbar at the bottom of the alerts section and move until you see event.severity_label. Click it once, and you will see the events that are classified as the most threatening.
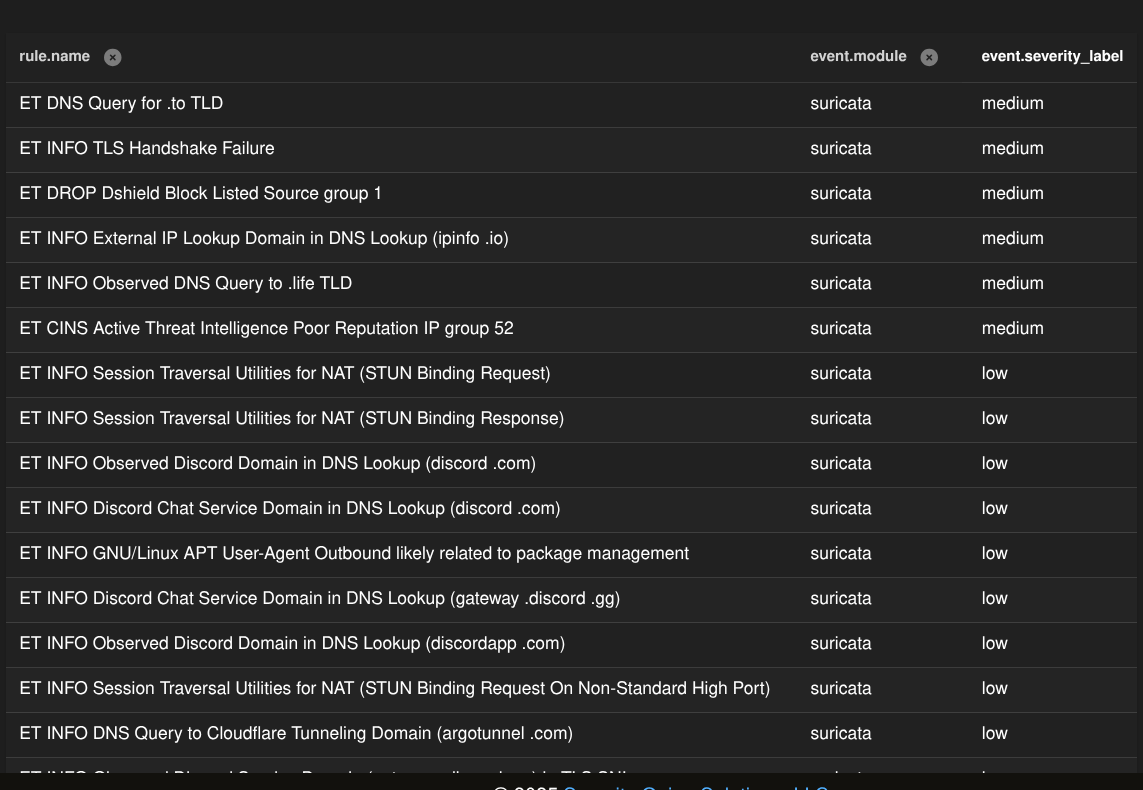
This ET DNS Query for .to TLD alert seems to want my attention. We can acknowledge it with the bell icon, escalate it to the cases tab with the warning icon, or get some information with the letter i.

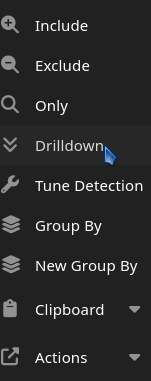
Well, what could we do? To get more information on the alert, click over the alert's name (in this instance, ET DNS Query for .to TLD) and you will get a pop-up menu. We want to use the Drilldown option.
You will now be shown the alert (and if the alert has been triggered multiple times, they will be shown in chronological order), plus a little more information. Something that could be useful are IPs and port numbers. If we scroll horizontally again, we can see just that.

Aaaaaand false positive. How do I know this? Well, the source IP 192.168.20.115 is my pi-hole instance, which is a local DNS resolver. It keeps going to 9.9.9.9 because that is one of the DNS resolvers for it, Quad9. That is the IP for it. So this is nothing to worry about.
Well, this is a bit irritating. Even if we acknowledge it and it disappears, we're still going to get this alert. We need to tune our alerts so we do not get this triggered anymore. Let's click on the alert name again, and this time, select Tune Detection and then the + button.
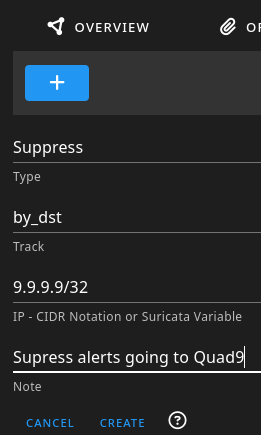
The options I chose above say this: For this rule, I do not want to get notified from the destination address 9.9.9.9. The /32 after the IP is the subnet mask, and /32 only allows the address put before it. I chose to do the destination address as opposed to the source address of 192.168.20.115 because pihole could go to a destination IP I could not recognize, in which I would go through that process again of drilling into the problem, possibly fine tuning some settings, and determining if it just needs to be acknowledged or further investigated.
Click the Create text, and that rule will now be active. We can now go back to the Alerts tab, acknowledge the alert, and we should not get notified of pihole going to 9.9.9.9 anymore.
Under the tools section, click on Elastic Fleet. It will present you with a log-in page that uses the same credentials you used to initially log into the Security Onion GUI.
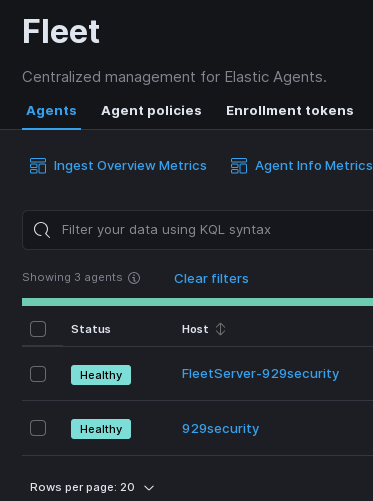
You will be presented with a screen that should look like this. Now, before we start adding an agent, we need to edit an agent policy to add file integrity monitoring, as it is not preconfigured by default. Go under the Agent policies, click on endpoints-initial, and then the Add integration button.
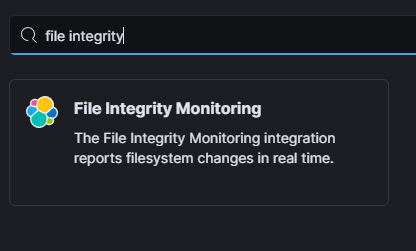
There are couple of options you could explore here, but we are primarily concerned with the File Integrity Monitoring integration. If you type in file integrity into the search bar, it will be presented to you. Click it, then click Add File Integrity Monitoring.
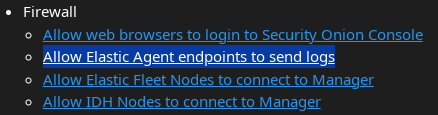
Before we can add the agent, we have to allow host integration through Security Onion's firewall. This isn't too bad of a task as it is a common thing to do. In the main Security Onion interface, go under Administration, then Configuration. On the right hand side, there will be some hyperlinks available. The second hyperlink under the Firewall section is what we are interested in.
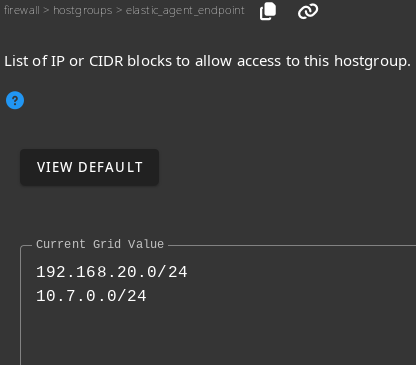
You will be presented with a box to type in any IP address ranges you would want to include for host monitoring. The first range I chose were for the internal services range. My laptop is mostly on a VPN to my home network, which is the second range listed.
Now we can add an agent. Go back to the main Security Onion interface, go to the downloads tab, and click the download link that aligns with the operating system of the host you will be installing the agent on. I will be installing my agent onto my Arch Linux laptop, so I will be installing the Linux x86_64 Installer option. Install it where you would like, execute the install file, and you should be good. Check back in the Elastic Fleet tab and you should see the hostname of your agent is now added to the list.
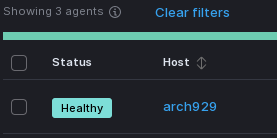
Now, if we go under Dashboards, locate the hostname section and click on the hostname (arch929) to filter out any other information, you are presented with a variety of ways to inspect different types of system events.
While network alerts are great, they do not provide the whole picture. With host integration, you are able to look into more specific events and make better decisions in certain incidents. More on that later in the hypothetical.
For clarification, I am not going to explain how to initially setup Snort. You need to install the package through pfSense, sign up for a Snort account, and obtain a Snort token in order to have it up and running.
As established in the last post, I configured my home network through a pfSense VM, and luckily, Security Onion is can be configured to integrate syslog files from a pfSense instance. Security Onion themselves have posted an excellent tutorial on setting this up.
In terms of something that I set up in pfSense, I put a Snort interface on my WAN port. Snort is an IDS/IPS package that you can install on pfSense to monitor network traffic. Now hold on, aren't we already doing this in Security Onion? Why, yes we are! Although, with the way that I configured the mirrored port, I am only monitoring network traffic on my LAN. I want some information that I can look at through my WAN*.
I put WAN with an asterisk because if I were just to put Snort with default detection rules on my WAN, pfSense would explode. There is a TON of network traffic that comes from your WAN, but most of it is harmless. It's purely background noise- some large internet providers pinging your public IP to optimize how they route their traffic, your IP pinging other online services to make sure you're connected, and bot scans that are not specifically towards you. Now, regarding that last one, what if someone IS trying to specifically scan your network? What if someone isn't trying to scan commonly vulnerable ports and they are trying to get as much detail about your network as possible? Wouldn't you like to know if someone would be attempting that? That was my intent with setting up Snort with just emerging scan rules on pfSense.
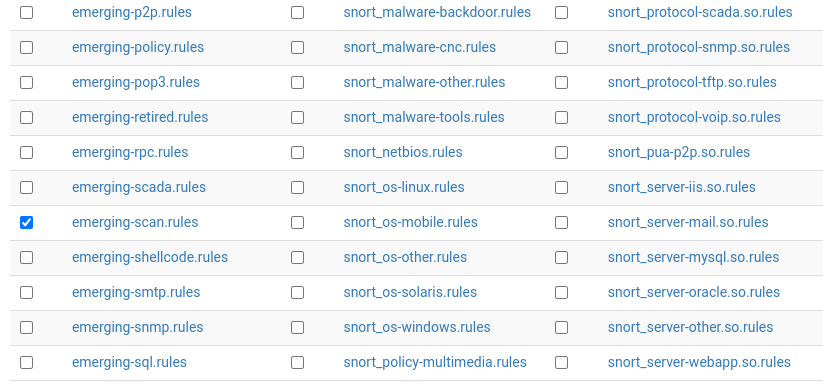
In order to achieve this, I added my WAN interface, went under the categories tab, and only selected emerging-scan.rules. You can see that there are of ton of options that are usually selected by default, so again, make sure you only select emerging-scan.rules. Then, you can turn on Snort for the interface.
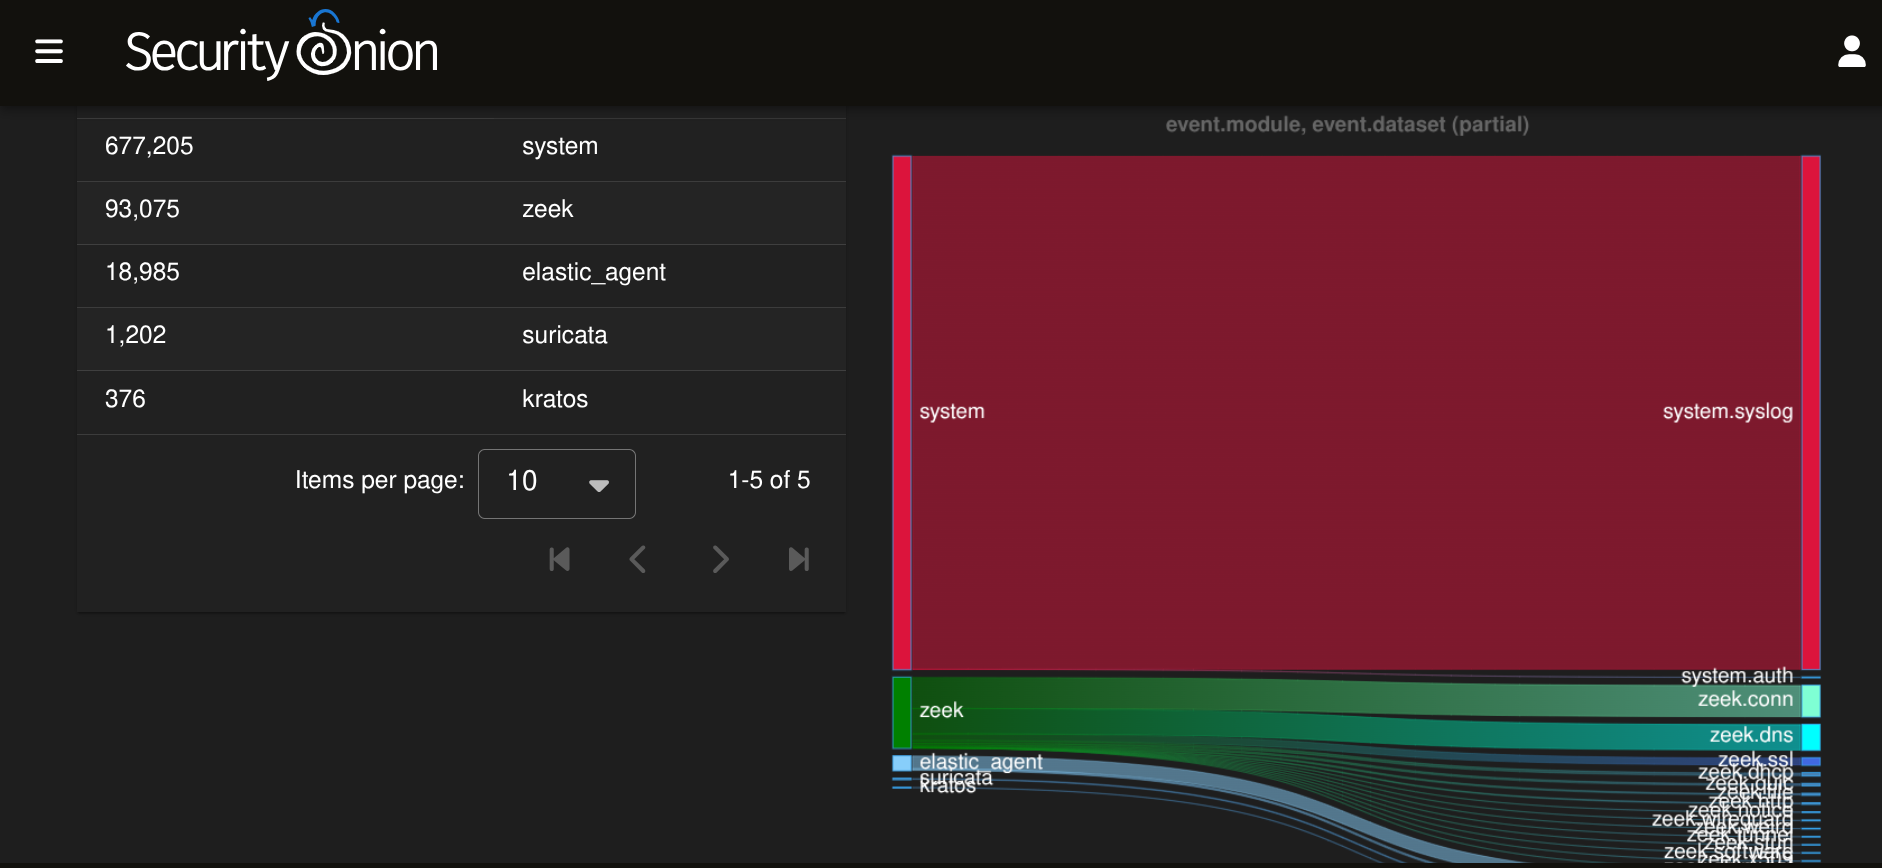
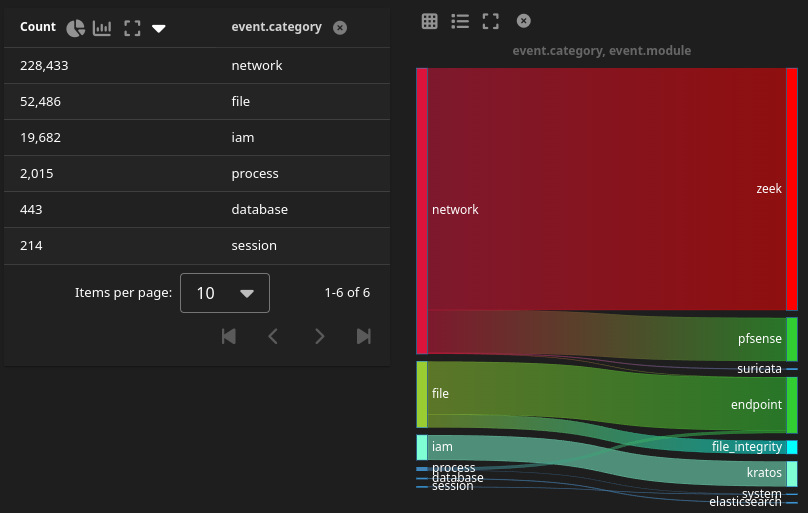
To see if logs are going through, go into Secutity Onion, go under the Dashboard tab, and find a box that has information regarding event.module. You should see pfSense listed. Click on the pfSense text, then Include.
You will see whatever information you desired to send to Security Onion from the tutorial video. We are interested in diving deeper into the alerts coming from Snort, which we can locate by finding the destination.ip section. You should see your public IP somewhere amongst the list; I will not be showing my public IP for privacy purposes, and I have replaced it with pineapple. Click pineapple and click Include.
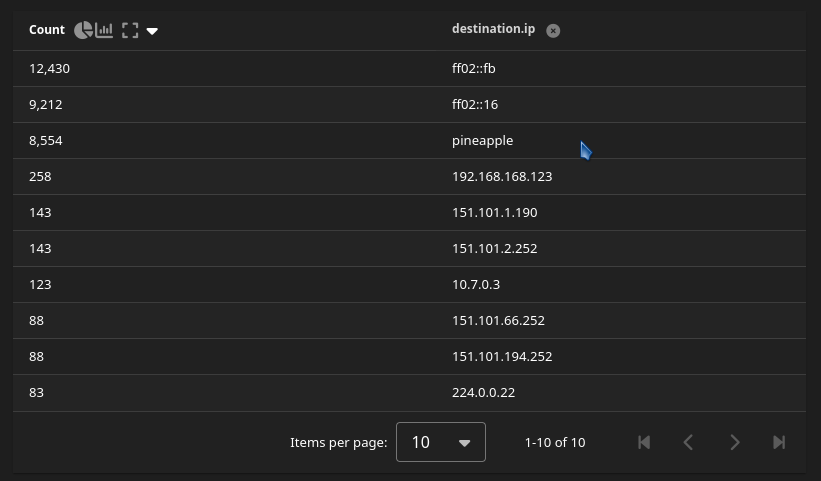
Click on your public IP, then Include, and then scroll down. You should see your Snort alerts inside of Security Onion.
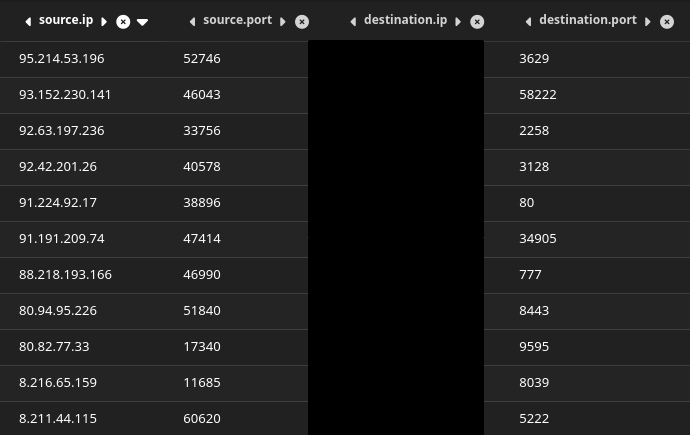
These are the same alerts that you would see if you were to look under the Alerts tab in Snort in pfSense. Why would we do this if we can just look at it there? Well, it's to improve the workflow. Centralizing all events to Security Onion to investigate is more convenient than downloading the PCAP files from pfSense, and then uploading them to Security Onion.
For the last part of this post, I made a simple scenario in which a user downloads and runs a suspicious file, and a case is built in Security Onion to determine if the system was "infected". Of course, I did not actually infect a computer for this scenario, the file I download in question runs this simple curl command:
curl -A "BlackSun" http://google.com/
This command connects to the google homepage under the user agent Blacksun, which is not a legitimate browser or tool user agent. Unusual user agents are flagged, and could indicate that a scanning tool or malware has been installed onto a computer. Also, google is being pointed to http, which in comparison to https, is not secure. This is completely harmless, but Suricata is going to flip when it sees this behavior on the network.
Envision: a crappy phishing email and a clueless employee.
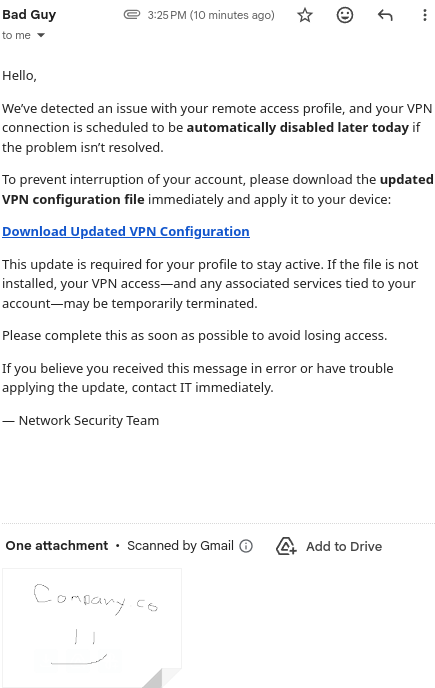
I could go on about social engineering and how you should just report this email, but this is the worst case scenario. This employee does not understand the technical jargin, they see that it's urgent, they have no user awareness training, so they fall for it. They download the file, and execute it. The SOC analyst gets this alert in his feed:

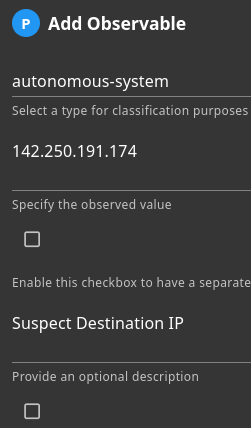
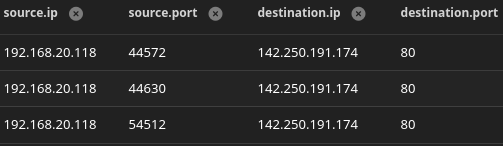
Being that the severity of the alert is high, it is brought to the analyst's attention. He digs into the alert, and finds a destination IP of 142.250.191.174.

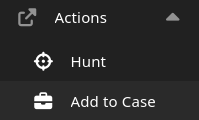
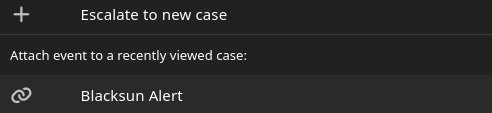
The destination IP is added to a case as an observable. The alert is clicked, and underneath the Actions section, Add to Case is clicked.
The case is given the name Blacksun Alert (by clicking the default name at the top, the name can be changed) and the destination IP is given a description. The observable is added.
The destination IP is further investigated. The analyst goes back to the alert, clicks on the destination IP, and goes under the Hunt section.

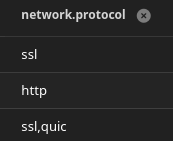
The Hunt section in Security Onion gives you any information involving what has been filtered to help further build a case. The analyst notices that there have been http connections underneath the network protocol section.
The analyst views some information regarding the source IP, 192.168.20.118. He knows that it is the IP of a virtual machine for VPN clients. He knows that a worker that is working remote had activity with an HTTP site.
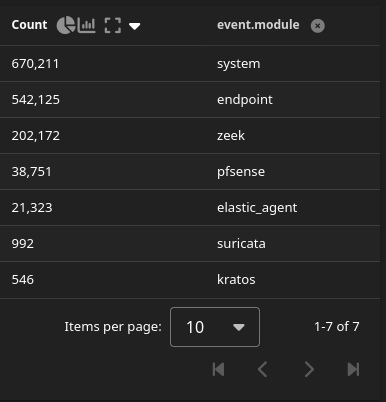
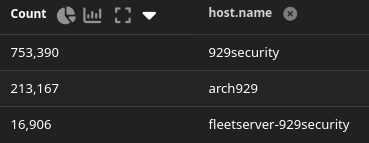
The analyst goes over to the Dashboards section and locates hostname section. The VPN hosts have endpoint clients installed onto them, and arch929 is one of them. It is clicked on and filtered out to see results from only that host.
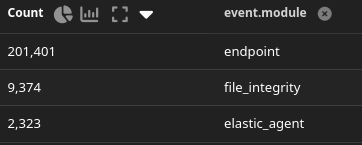
The analyst isolates the events further but going to event module section and filtering the endpoint logs.
The analyst notes an event in the logs that happend around the same time as the Suricata alert. The event is added to the Blacksun Alert case.

The information from the event is investigated in the case. The source IP of 10.7.0.3 is found, a subnet found in VPN connections. The curl command is also found, which activated the alert.


It is concluded that the host machine has been compromised. It is quarantined by being taken offline, the infection is contained and the system is recovered to its previous state, and the team reflects on how this incident could have been prevented.
Is this the most extensive example? No. Could it have been investigated in a different way? Absolutely. The alert itself could have been added to the case, the domain could have been added, there were multiple ways to approach this situation. This is just how "the analyst" approached it (me).
This is basically scratching the surface for Security Onion. I didn't jump into all the tools, I didn't add a whole lot to the setup, but I demonstrated the minimum to show what it is capable of. Looking at the different network alerts that I have gotten over this project has been fun to investigate, although it has made me a little paranoid about what exactly goes on in my home network. Sometimes, I looked into things where I thought something was terribly wrong, when there was simply nothing to worry about.
Anyways, this project should have been finished long ago. It started at the beginning of August, and then the fall semester killed all of the momentum. It has been dangling over my head for months, but I think I can finally put it to rest and move on to other ventures. I've been wanting to work on something else related to coding or hacking related, but I had to finish this first. Hopefully over winter break I can cook something up.
From P.